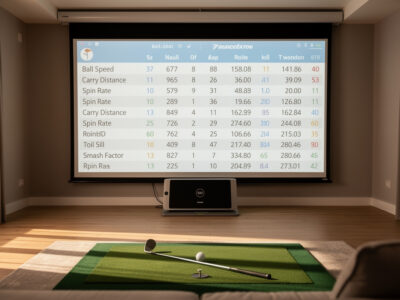
A golf simulator swing analysis guide starts with one honest truth: the screen shows you a flight, but the numbers underneath are where the practice actually lives. In my sim room I read the 10 to 14 metrics a good monitor reports on every shot, and I’ll show you which of those numbers to trust at each price tier and which to ignore until your strike is clean.
Most home golfers buy a launch monitor, watch the ball curve onto the fairway graphic, and never once open the data table that explains why it curved. That table is the whole point. The graphics are flattery; the numbers are feedback. This guide is the map I wish I’d had when I framed my enclosure and started logging winter swings against the same launch monitors, session after session, looking for patterns the eye can’t see.
What Does Golf Simulator Swing Analysis Actually Measure?
Swing analysis in a home sim is the act of reading the metrics behind each shot, ball data (carry, total, ball speed, spin, launch, spin axis) and club data (club speed, smash factor, club path, attack angle, face angle) to find repeatable patterns. A typical photometric unit reports 10 to 14 of these per shot.
The split between ball data and club data matters more than any single number. Ball data is what every monitor captures, even a sub-$300 radar unit reads ball speed and a launch estimate. Club data, the path and face and attack angle that actually explain the ball flight, is harder to capture and is where the price jumps. When I run my Garmin Approach R10 next to a SkyTrak+-class photometric on the same swings, the ball numbers track close; it’s the club delivery numbers where the gap shows. Knowing which bucket a number lives in tells you how much weight to put on it.
Which Shot Metrics Should You Read First?
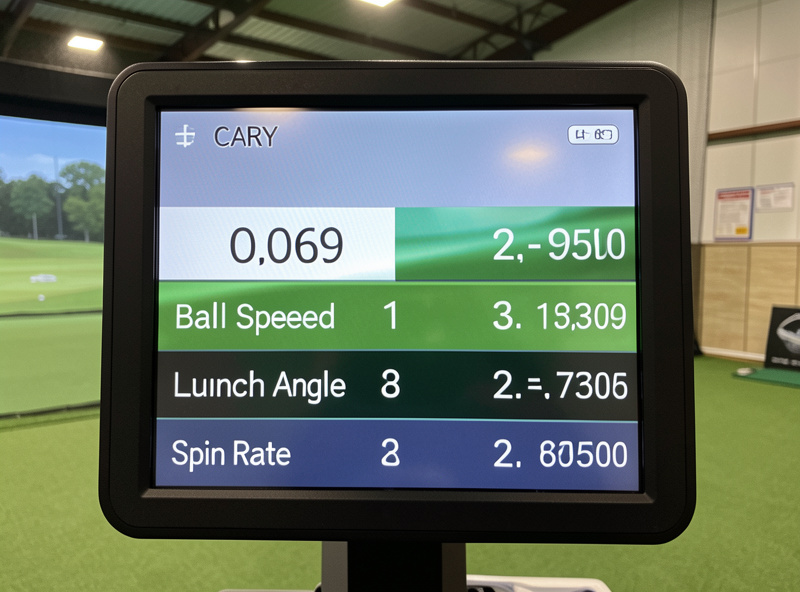
Start with three: carry distance, spin rate, and dispersion (left-right spread). These three explain the vast majority of why a shot finished where it did, and every launch monitor on the market reports at least the first two with usable confidence.
Carry tells you how far the ball flew through the air, the number that actually maps to club selection on a real course. Spin rate explains why two shots with identical ball speed finish 20 yards apart: too much backspin balloons a drive and costs carry; too little drops it short with no stopping power on irons. Dispersion, the side-to-side scatter of a group, is the single most under-read metric in home golf, and the one I care about most, because a tight bad average beats a wild good average every round. Read these three before you ever glance at smash factor or spin axis.
How Do You Tell Real Patterns From Sim Noise?
You separate signal from noise by hitting groups, not single shots, and by ignoring the outliers. A reliable pattern needs at least 8 to 10 shots with the same club; one screaming 290-yard drive among nine 250s is noise, not a trend you can train.
Every launch monitor has measurement error, and the cheaper the unit the wider that error band. A radar unit in a short room is extrapolating from a partial flight; a photometric unit in bad lighting can misread spin. The way I protect my winter practice data is simple: I hit ten balls, throw out the obvious mishits I felt at impact, and read the median of the rest, not the best one. The best shot is the one your brain wants to believe; the median is the one that shows up on the course. Group reading is the discipline that turns a toy into a coach, and it’s the through-line of every spoke in this cluster.
Club Data vs Ball Data: What’s the Difference?
Ball data measures what happens to the ball after impact; club data measures what the clubhead did to create it. Ball data answers “what happened,” club data answers “why.” Entry-tier monitors give you reliable ball data and estimated or absent club data.
This distinction governs your whole buying decision. If your strike is inconsistent, club data (path, face, attack angle) is gold, it tells you the cause of the curve. But club data is also the hardest thing to measure accurately at home, and a wrong path reading sends you chasing a fault that isn’t there. My rule, learned the hard way after a winter spent “fixing” an out-to-in path my budget radar unit invented, is to trust ball data first, treat estimated club data as a hint, and only act on club delivery numbers from a unit that genuinely measures the club, not infers it. The deep-dive on this lives in the shot-data spoke below.
| Metric | Data Type | What It Tells You | Trust at Budget Tier? |
|---|---|---|---|
| Ball speed | Ball | Energy transferred to the ball | High |
| Carry distance | Ball | Air distance for club selection | High |
| Spin rate | Ball | Stopping power and height | Medium |
| Spin axis | Ball | Curve direction and amount | Medium |
| Club speed | Club | Power input, training target | Medium |
| Smash factor | Derived | Strike efficiency (speed ratio) | Medium |
| Attack angle | Club | Up/down strike direction | Low (often estimated) |
| Club path | Club | Swing direction through impact | Low (often estimated) |
How Can You Use Launch Monitor Data to Improve?
You improve by picking one metric, setting a measurable target, and hitting toward it for a full session instead of chasing every number at once. The fastest gains at home come from spin and dispersion work, not from adding swing speed nobody can control yet.
The mistake I see, and made, is treating every session like a fitness test where you want all the numbers to go up. That’s not practice, that’s anxiety with a graphic. Real improvement is narrow: one winter I did nothing but seven-iron spin windows, aiming to land every ball inside a 500-rpm band, and my approach consistency on the course the next spring was the best it had ever been. Pick a lane. The data-to-practice method gets its own full spoke below, because it’s the part of this hobby that separates people who get better from people who just enjoy the light show.
Reading Attack Angle and Club Path Without Fooling Yourself
Attack angle (whether the club is moving up or down at impact) and club path (its left-right direction) are the two club-delivery numbers home golfers obsess over and misread most. Both are frequently estimated rather than measured on units under roughly $2,000.
Attack angle is genuinely useful, a positive attack angle with the driver adds carry, a negative one with irons compresses the ball, and these are trainable. But the number is only as good as the unit measuring it, and a misplaced radar monitor in a short room will hand you an attack angle that’s off by degrees. Club path is even touchier: it interacts with face angle to produce the curve, and reading path in isolation is how people “fix” a draw into a slice. I keep a hard line in my sim room, if the unit is estimating these, I use them directionally (“am I trending up or down with the driver?”) and never as a precise coaching input. The attack-angle spoke goes deep on placement and trust.
Using Data to Reduce Dispersion (The Number That Wins Rounds)
Dispersion is the left-right scatter of your shots, and tightening it is the single highest-value thing data can do for a home golfer’s actual scores. A 30-yard dispersion oval that shrinks to 18 yards changes which greens you can attack.
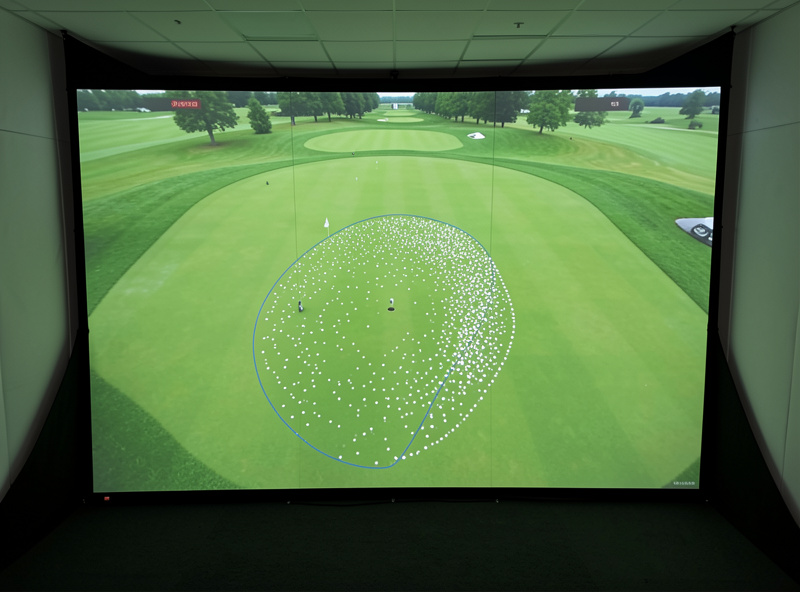
Here’s the reframe that changed my own practice: distance is loud, dispersion is quiet, and dispersion is what costs you strokes. The sim makes this measurable in a way the range never could, because it draws your shot group as an oval you can literally watch shrink. The work is unglamorous, slower swings, neutral setups, a stable lower body, and you measure it by the width of the group, not the length of the best one. The dispersion spoke below lays out the drills and how to read the oval honestly. This is where “may help reveal patterns” stops being a hedge and becomes the whole reason a sim earns its space in your house.
Smash Factor and Strike: The Honesty Check
Smash factor is ball speed divided by club speed, and it’s the cleanest single number for telling you whether you actually hit the center of the face. A driver smash near 1.50 means efficient contact; an iron in the 1.38 to 1.43 range is the realistic home target.
I treat smash factor as the lie detector of the data table. You can swing harder all you want, but if smash drops, you’re trading center contact for speed and the ball goes nowhere useful. The number cuts through the self-deception that distance training invites. When I’m chasing club speed in a winter speed block, I watch smash like a hawk, the moment it falls off, I know I’ve left the sweet spot and the session has stopped being practice and started being ego. The useful drill is to log smash across a ten-ball group and watch the consistency, not the peak. A repeatable 1.46 driver smash beats a one-off 1.50 followed by four toe strikes, because the course is played on your average, not your highlight. Smash also quietly validates everything else: if your carry numbers look great but smash is jumping around, the launch monitor is reading clean strikes and mishits as if they were the same swing, and your “pattern” is really just contact roulette.
Building a Practice Log You’ll Actually Read
A practice log turns scattered sessions into a trend line, and it’s the difference between feeling like you’re improving and knowing it. You don’t need software, a single note per session with club, the metric you trained, and the median result is enough to see movement over a winter.
Most sim software stores session history, but the raw export is overwhelming and nobody reads a 400-row spreadsheet. What I actually keep is deliberately small: date, the one club I focused on, the one metric I was training, and the median number from my best group of ten. Five lines. Over a Swedish winter those five-line entries stack into a story, my seven-iron spin band tightened from a 900-rpm spread in November to under 500 by February, and I could prove it instead of hoping it. The log also kills the recency trap, where one good session convinces you you’ve fixed something that the data, read across six weeks, says you haven’t. Keep it boring and keep it short, because a log you don’t maintain is worse than no log, it gives you false confidence in numbers you stopped checking. The metric-improvement spoke below shows the exact format I use and how to read a trend line without fooling yourself.
Common Data-Reading Mistakes (I’ve Made Most of Them)
The most common mistake is reading single shots instead of groups, followed closely by acting on estimated club data as if it were measured. Both lead you to “fix” faults that don’t exist and chase numbers your equipment can’t reliably report.
My personal hall of shame is instructive. I once spent three weeks adding loft to my driver setup because my budget radar unit kept reporting a low, spinny launch, only to discover, when I borrowed a photometric unit, that the radar was misreading spin badly in my short room. The fix was the equipment, not the swing. Another winter I “developed a slice” that was entirely a club-path estimation artifact, my actual ball flight was straight, but the path number had me grinding on a problem the ball never showed. The lesson runs through every spoke in this cluster: believe the ball data first, because it’s measured; treat club data as a hint until you own a unit that genuinely captures it; and never, ever train off a single shot. The sim is a feedback instrument, not an oracle, and the people who improve fastest are the ones who stay skeptical of their own gear. If a number surprises you, your first question should be “is my equipment capable of measuring this here?” before “what’s wrong with my swing?”
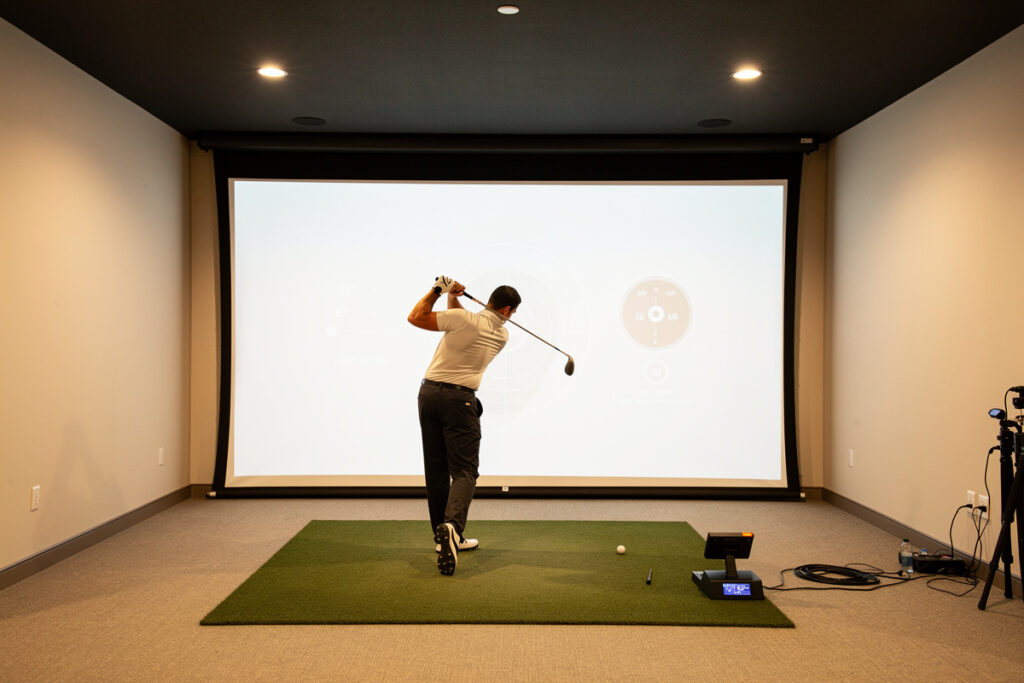
Adding a Camera: Video Analysis in the Sim Room
A camera pairs the numbers with the motion that produced them, letting you see whether a club-path change you intended actually happened. A single down-the-line camera at the right height and distance covers most of what a home golfer needs.
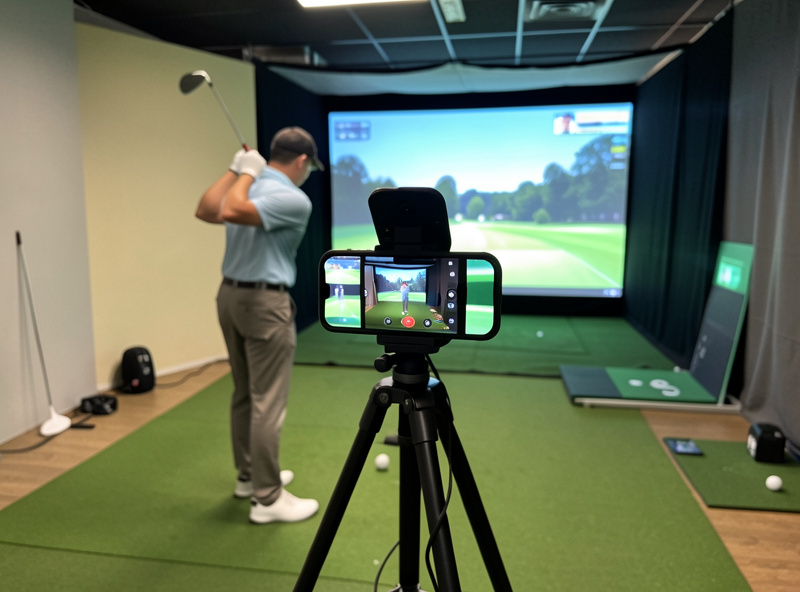
Numbers tell you what your swing produced; video tells you what your swing looked like producing it, and putting the two together is how a fault becomes obvious. You don’t need a three-camera coaching rig. In my room a single phone on a tripod, down-the-line at hip height and about 8 to 10 feet back, catches the path and plane information that explains the dispersion the launch monitor is reporting. The crossover from my sim-racing days helped here, I’d already fought cameras and mounts into a rig before I ever filmed a swing. The video-setup spoke covers exact placement, lighting against a bright screen, and the free apps that draw the lines for you.
Matching Your Data Ambitions to Your Hardware
The metrics you can actually train are capped by what your launch monitor measures rather than estimates, so honest expectations start with knowing your unit’s limits. A radar unit in a short room and a photometric unit in good light are not reading the same reality, even at the same price.
This is the part the marketing pages skip, and it’s why my whole method is hardware-aware. If you own a budget radar monitor, lean hard into ball-data training: carry windows, spin control, dispersion, the things it genuinely measures. Reserve club-path and attack-angle work for the day you own a unit that captures the club directly. There’s no shame in the budget tier, my Garmin Approach R10 logged the winter that tightened my dispersion more than any lesson, but pretending it measures club path precisely in a 9-foot room is how you waste a season. If you’re weighing what the next tier buys, the honest breakdown of where budget units diverge from photometric ones lives in the radar vs photometric comparison, and the specific limits of the most popular home unit are laid out in the Garmin R10 honest-limits piece. Knowing what numbers to trust is itself a skill, and the data-to-trust guide is the companion every analysis session should sit on top of.
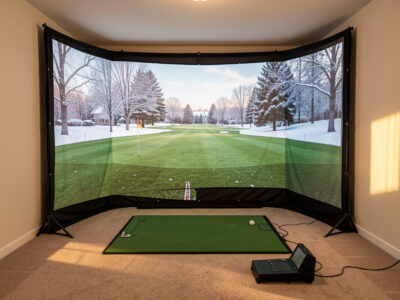
Why the Room Comes Before the Data
The numbers a launch monitor reports are only as honest as the space the swing happens in, a cramped room produces guarded swings and skewed data. Ceiling height and ball-flight depth directly shape whether your readings reflect your real swing or a defensive version of it.
I learned this in reverse order, like most people do, by buying the monitor before fixing the room and then wondering why my driver numbers looked nothing like the course. A short ceiling makes you steepen and shorten the swing without realizing it, and the data faithfully records a swing you’d never make outdoors. Adequate depth matters too, because radar units especially need ball-flight distance to read accurately. Before you invest a single session in metric training, make sure the space supports a full motion, the ceiling height guide and the room depth guide cover the exact minimums by club and player height. Good data is downstream of a good room. No amount of clever analysis rescues numbers gathered from a swing the room won’t let you make.
Strokes Gained at Home: Use It Carefully
Strokes gained is a framework for measuring shot quality against a baseline, and some sim software offers a home version of it. It’s a useful lens for spotting which part of your game leaks the most, but the home numbers are directional, not tour-grade, so read them as a compass rather than a verdict.
I use strokes-gained thinking loosely, mostly to settle the eternal question of where my winter practice time should go. If the data keeps showing my approach shots scattering while my driving holds, that tells me where the hours belong, regardless of which graphic looks prettier. What I don’t do is quote a home strokes-gained figure as if it were measured on a PGA baseline, the sample is too small and the inputs too noisy for that. The honest use is comparative and personal: am I gaining on my own past self in this category over six weeks? That’s a question a home sim can answer well, and it keeps the focus on dispersion and contact, the things you can actually train, rather than an abstract score. For readers stepping up from the entry tier and wondering what richer data unlocks this kind of analysis, the sub-$1,000 monitor breakdown sets honest expectations for what the affordable units can and can’t feed into it.
How This Cluster Fits Your Whole Sim Build
Swing analysis is the payoff layer, it sits on top of the room, the launch monitor, and the enclosure you’ve already built. It’s the reason all that space and money turns into a better golfer instead of an expensive video game.
If you’re still planning the space, start with the golf simulator room requirements guide, because no amount of data reading fixes a swing you can’t make in a low-ceiling room. If you haven’t chosen your data-capture hardware, the budget launch monitor guide explains what numbers each tier can actually measure, which is the foundation everything in this analysis cluster sits on. And the DIY enclosure and screen guide covers the build that makes year-round practice possible. This swing-analysis cluster is the next step up, what to do with the data once the hardware is humming.
Frequently Asked Questions
Can a golf simulator actually improve my swing?
A simulator gives you measurable feedback on carry, spin, and dispersion that the range cannot. It does not improve your swing by itself, but reading the data and training one metric at a time may help reveal patterns you can work on year-round.
Which launch monitor metric should beginners read first?
Start with carry distance, spin rate, and dispersion. These three explain most of why a shot finished where it did, and every monitor reports at least carry and spin with usable confidence. Leave club path and attack angle until your strike is consistent.
How many shots do I need for the data to mean anything?
Hit at least 8 to 10 shots with the same club and read the median, not the best one. Single shots are noise. Cheaper monitors have a wider error band, so group reading matters more, not less, at the budget tier.
Is club data on budget launch monitors accurate?
Ball data such as ball speed and carry is reliable on most monitors. Club data like path and attack angle is often estimated rather than measured on units under roughly two thousand dollars, so use those numbers directionally rather than as precise coaching inputs.
Do I need a camera if my launch monitor gives me numbers?
No, but a single down-the-line camera pairs the numbers with the motion that produced them. It is the cheapest upgrade for understanding why the data looks the way it does, and a phone on a tripod covers most home needs.
What single number should I work on to score better?
Dispersion, the left-right scatter of your shots. Distance is loud but dispersion quietly costs strokes. Watching your shot group shrink on screen is the clearest measurable practice goal a home simulator offers.